|
Exploits River Near Real Time
Data
Most recent conditions in Badger Due to the volume and frequent updating of the water level and other data made available on this web site this data is considered to be PROVISIONAL because it has not undergone quality control checks. These data may be subject to significant change.
Graphs
are updated daily every 2 hours RADAR Images for Exploits River
50 km - Upstream of Badger
(1 km Below the Dam at Beothuck Lake)
25 km - Upstream of Badger
25km - Upstream of Badger
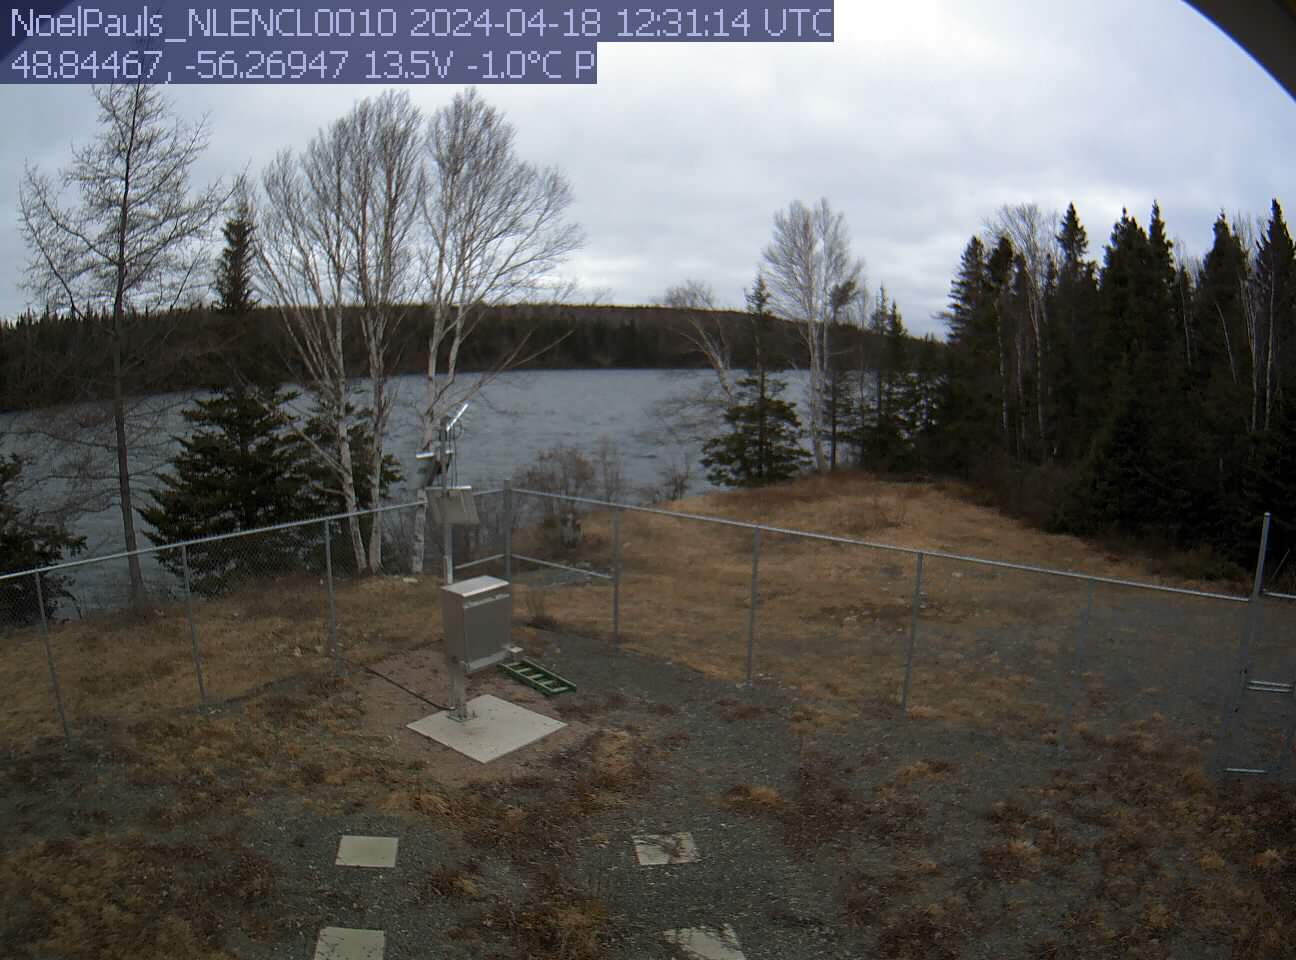
Exploits below Noel Paul's Brook MET Station Camera looking Upstream
*Temperature listed in image is of the camera, not ambient air temperature. Video Clip of Images From Last Three Days Visit the Web Page for this Station
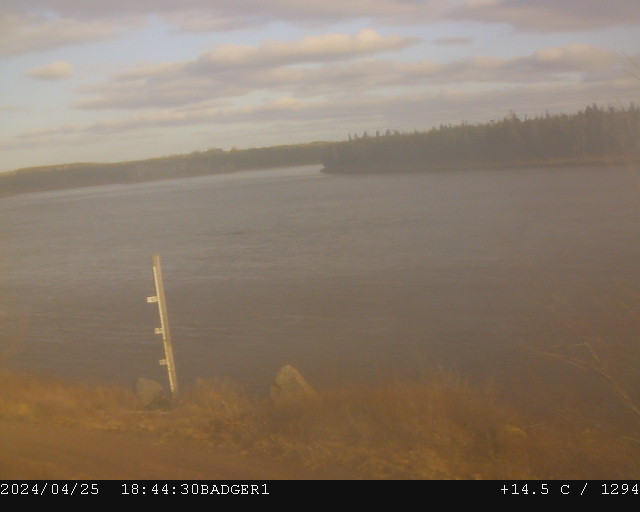
Most recent conditions in Badger
Video Clip of Images From Last Three Days (35 Mb Avi file) View the web page for this station (includes climate data)
Hourly Data for past 7 days - 02YO013 |
Excel CSV Format
Daily Summaries for past 35 days - 02YO013 | Excel CSV Format View data from this station on the Environment Canada web site Click the " I accept" button and the graph should appear. 7 km - Downstream of Badger looking Upstream
Tributary to Exploits River
Return to Badger Water Level Information Page
|
| Exploits River and Notre Dame Bay | ||||||||||||
| Tertiary Basin | Name | Stage-Flow | Vertical Datum | Flood Warning | WQ | Climate | Snow |
Water Temp |
GW | Camera | ADRS | EC |
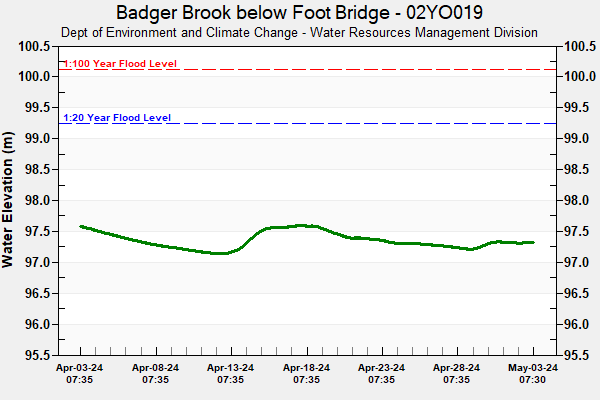
| 02YO | Badger Brook below Foot Bridge | Elevation | CGVD28 | FW | WT | 02YO019 | EC | |||||
| 02YO | East Pond Brook below East Pond | Stage/Flow | Assumed | WQ | WT | NF02YO0192 | EC | |||||
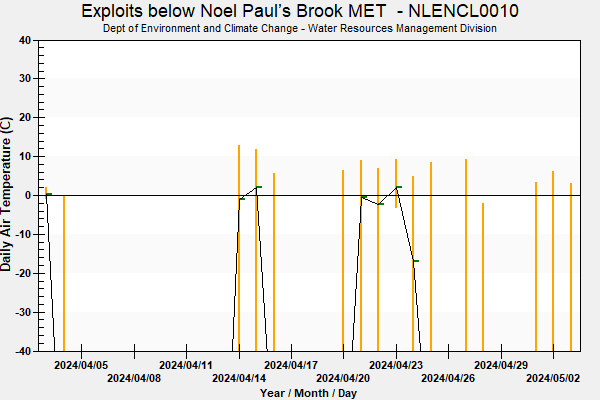
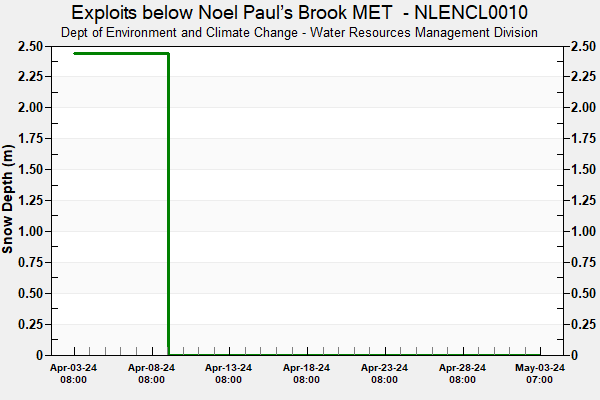
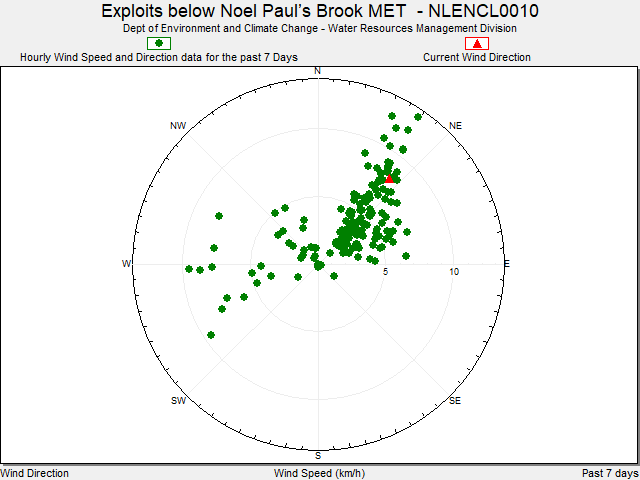
| 02YO | Exploits below Noel Paul's Brook MET | Climate | Snow | NLENCL0010 | ||||||||
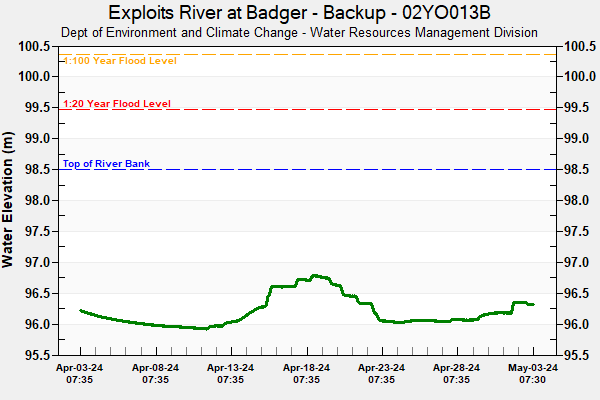
| 02YO | Exploits River at Badger | Elevation/Flow | CGVD28 | FW | 02YO013B | EC | ||||||
| 02YO | Exploits River at Badger East of Stadium - Weather Station | Climate | Snow |
|
NLENCL0002 | |||||||
| 02YO | Exploits River at Badger Steps |
|
NLENCM0001 | |||||||||
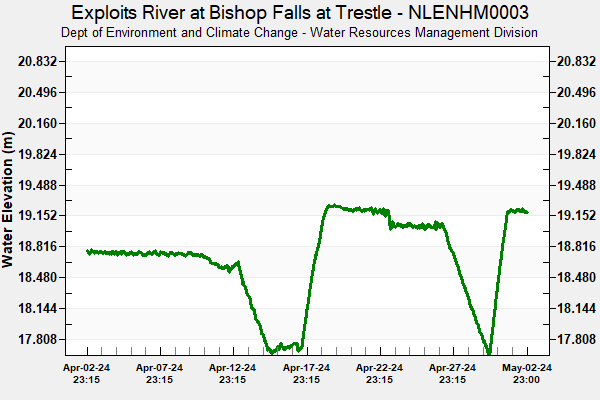
| 02YO | Exploits River at Bishop's Falls Trestle | Stage | Assumed |
|
NLENHM0003 | - | ||||||
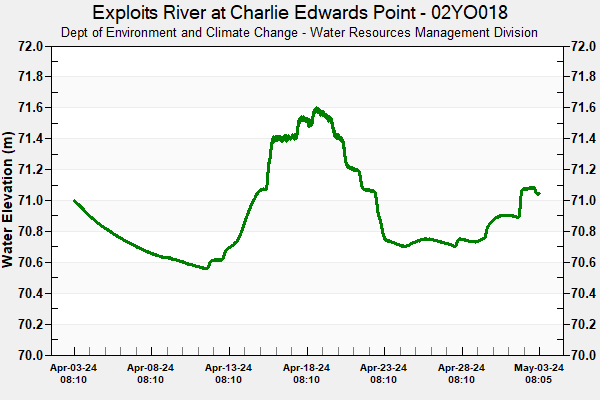
| 02YO | Exploits River at Charlie Edwards Point | Elevation/Flow | CGVD28 | 02YO018 | EC | |||||||
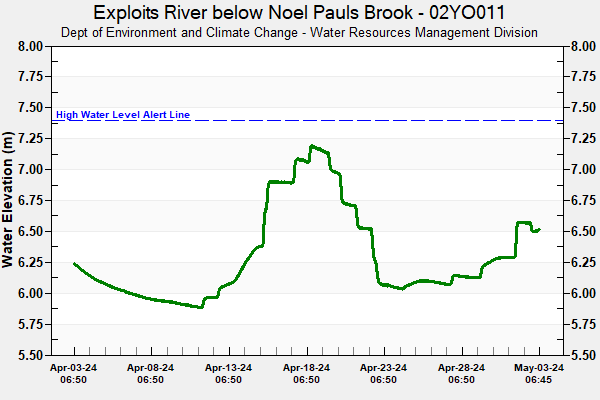
| 02YO | Exploits River Below Noel Pauls Brook | Stage/Flow | Assumed | HF | Climate | WT | 02YO011 | EC | ||||
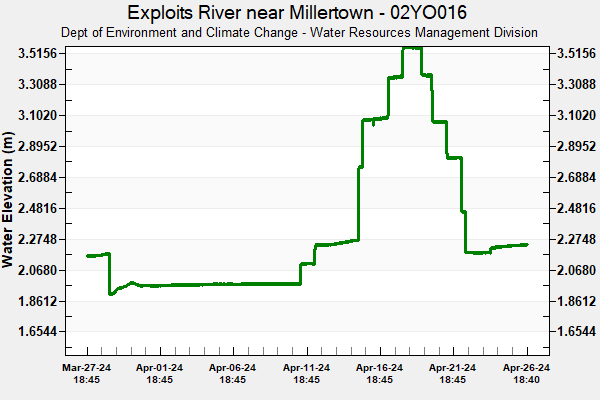
| 02YO | Exploits River Near Millertown | Stage/Flow | Assumed | WT | 02YO016 | EC | ||||||
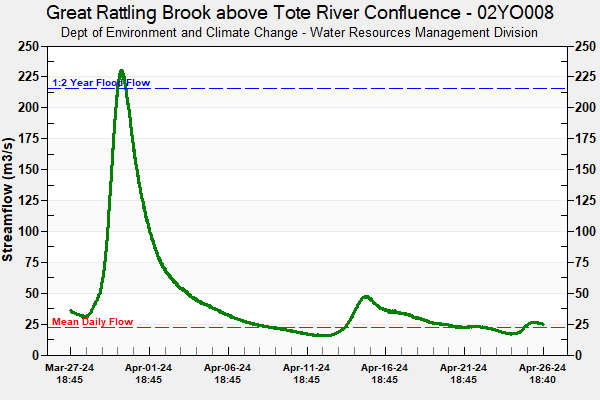
| 02YO | Great Rattling Brook Above Tote River Confluence | Stage/Flow | Assumed | HF | WT | 02YO008 | EC | |||||
| 02YN | Lloyds River Below King George IV Lake | Stage/Flow | Assumed | HF | WT | 02YN002 | EC | |||||
| 02YO | Peters River Near Botwood | Stage/Flow | Assumed | WT | NF02YO0121 | EC | ||||||
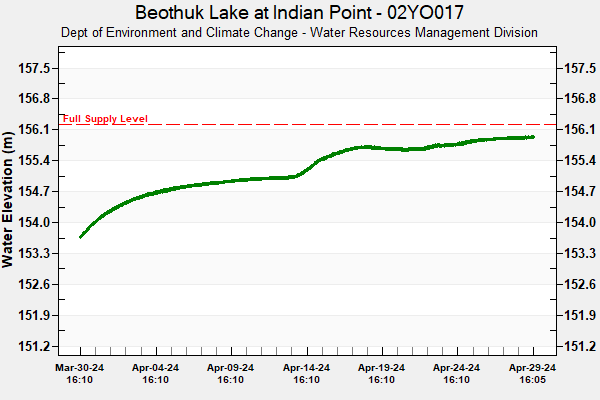
| 02YO | Beothuck Lake at Indian Point | Elevation | CGVD28 | 02YO017 | EC | |||||||
| 02YN | Star Brook Above Star Lake | Stage/Flow | Assumed | 02YN004 | EC | |||||||
| 02YN | Southwest Brook at Lewisporte | Stage/Flow | Assumed | HF | 02YO012 | EC | ||||||
| 02YO | Tributary to Gills Pond Brook | Stage/Flow | Assumed | WQ | WT | NF02YO0190 | EC | |||||
| 02YN | Victoria Lake at Northeast Control Structure | Stage | Assumed | 02YN005 | EC | |||||||
| 02YO | Duck Pond Well after Tailings Dam | WQ | WT | GW | NF02YO0193 | |||||||
Note: The date/times shown on the graphs are NST. There is no adjustment made for Daylight Savings Time.
| The station characteristics described below give a general overview of the sensors installed at each site. | |
| Definitions | Description |
| Tertiary Basin | The Water Survey of Canada has a 3-level hierarchy of drainage areas for the purpose of managing hydrometric stations. The first two digits indicate the major drainage basin based on the ocean to which it flows. The last two letters indicate a sub-basin (tertiary ) of the major drainage basin. A full hydrometric station identifier ends in three digits which indicate the nth station installed in that basin. |
| Stage-Flow | Water elevation, stage and/or flow are measured. A more complete description of these terms is available here. |
| Vertical Datum | A vertical datum is a reference surface that represents zero, against which elevations are measured. The location of zero can be arbitrary (assumed datums), based on decades of level lines (CGVD28), or more recently; on a model of the planet’s gravity field from satellites (CGVD2013). |
| Flood Warning | FW - Stage or Water Elevation graph at this station contains flood warning lines. HF - Streamflow graph at this station contains high flow alert lines. |
| WQ | Water Quality parameters are measured. Additional information on the Real-Time Water Quality Program is available here |
| Climate | Climate parameters such as precipitation, air temperature, etc are measured |
| Snow | These are climate stations where parameters such as snow depth, snow-water equivalent etc. are measured, |
| Water Temp | Water Temperature is measured at this site. |
| GW | This site is a drilled well where Groundwater elevation is measured. |
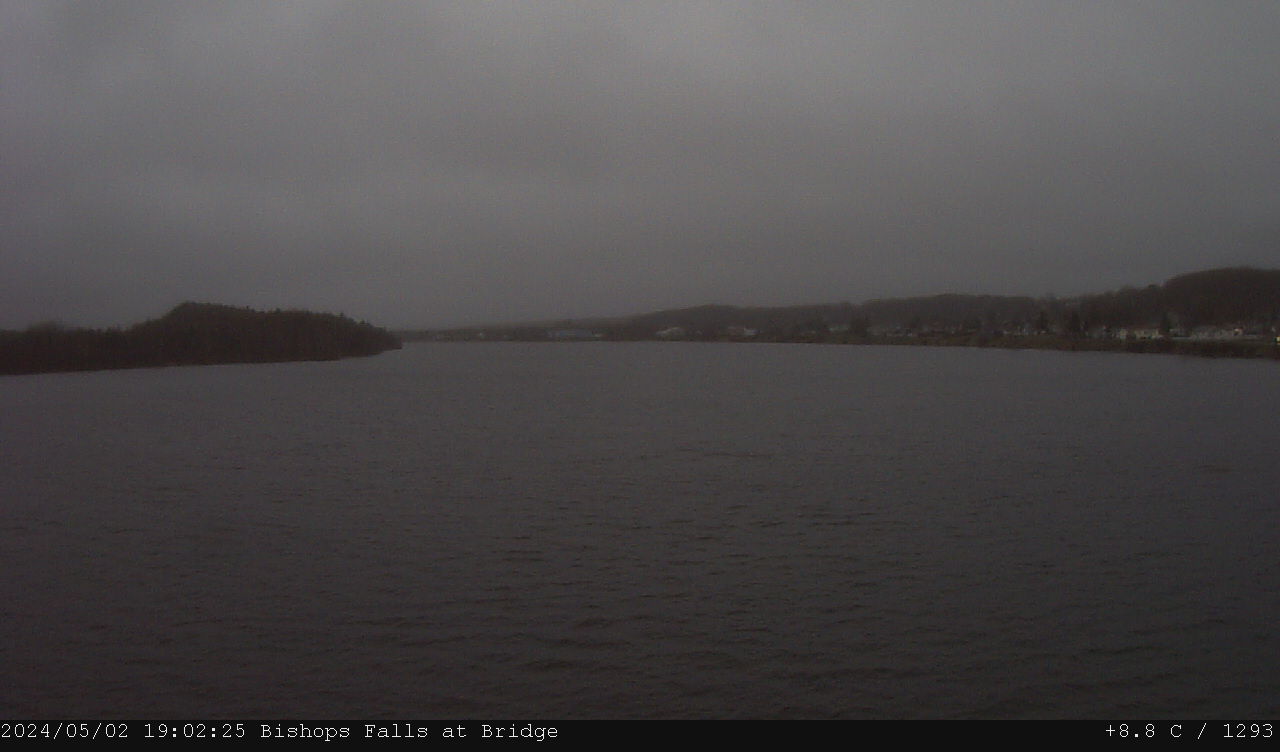
| Camera | A Webcam is installed at this site. |
| ADRS | This link displays the web
page for this station which includes graphs of all data and downloadable
csv files. Due to the volume and frequent updating of the data the streamflow, water quality and climate data shown is PROVISIONAL and has not undergone quality control checks. These data may be subject to significant change. |
| EC | This link is to the Environment Canada, Water Survey of Canada web page for this station. Provisional Stage-Flow data and Stage-Flow data that has gone through a comprehensive QA/QC procedure are available. There are also links to historical publication quality Stage-Flow data and summaries for each station. |