Department of Environment and Climate Change
Churchill River Stations - from Lake Melville to Churchill Falls
| Due to the volume and frequent updating of the data available on this Web site the streamflow and water quality data is PROVISIONAL and has not undergone quality control checks. These data may be subject to significant change. |
| Spikes in Dataset It is important to note that the following graphs may have “spikes” in them. Spikes are defined as any sudden increase/decrease in recorded data that does not seem reasonable. It is important to watch out for these spikes when reviewing the station data. There are a few reasons why spikes occur: Ice Formation on the River Ice formation on the river in winter months can cause water levels to rise even though the streamflow remains constant. The water level measurement instrument will then report higher water levels, which results in incorrect streamflow values been reported. Temporary Ice Blockage Temporary ice blockage that occurs downstream of the station will back up the river and cause a rise in water levels at the station. This means the calculated flow will be incorrect. This is known as “backwater”. Ice blockage that only occurs in short duration may cause the graph to show a spike that quickly disappears. Multiple spikes may appear if ice blockages form and break up quickly. Freezing Instruments If a portion of the data recording instrument that is in the river freezes (or otherwise malfunctions) spikes may appear on the graph. This can also result in a series of spikes which occur repeatedly as conditions in the river change. |
Graphs
are updated daily every 2 hours
Most Recent conditions in Mud Lake
50km - Downstream of Muskrat Falls
9.5km -
Downstream of Mud Lake
Visit the Web Page for this Station
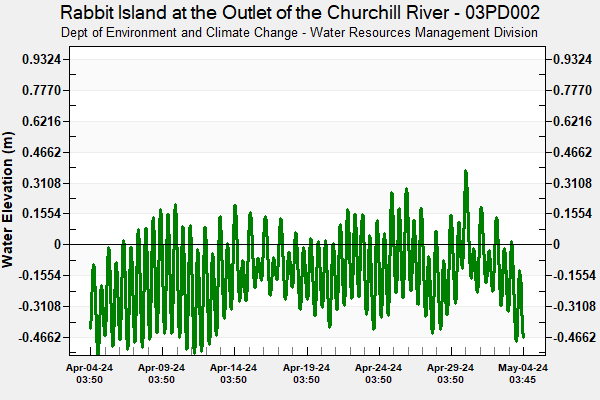
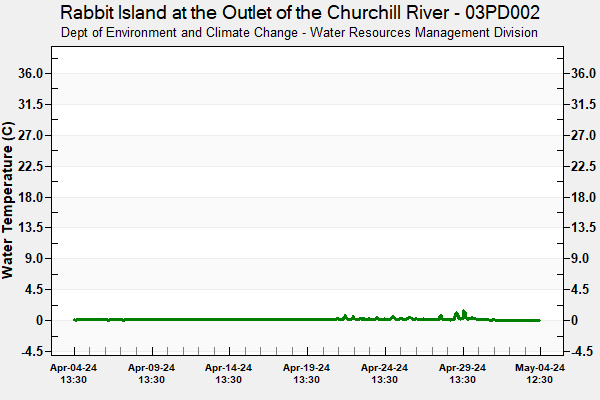
| Rabbit Island at the Outlet of the Churchill River is used to monitor baseline water level data downstream of the Lower Churchill Hydroelectric Generation project. The station is located 50 km downstream of Muskrat Falls and 9.5 km downstream of Mud Lake. This station collects: Water Stage (water level with assumed elevation), and Water Temperature. |
23km - Upstream of Rabbit Island on Goose River
*Temperature listed in image is of the camera, not ambient air temperature.
Video Clip of Images From
Last Three Days (Avi file)
Visit the Web Page for this Station
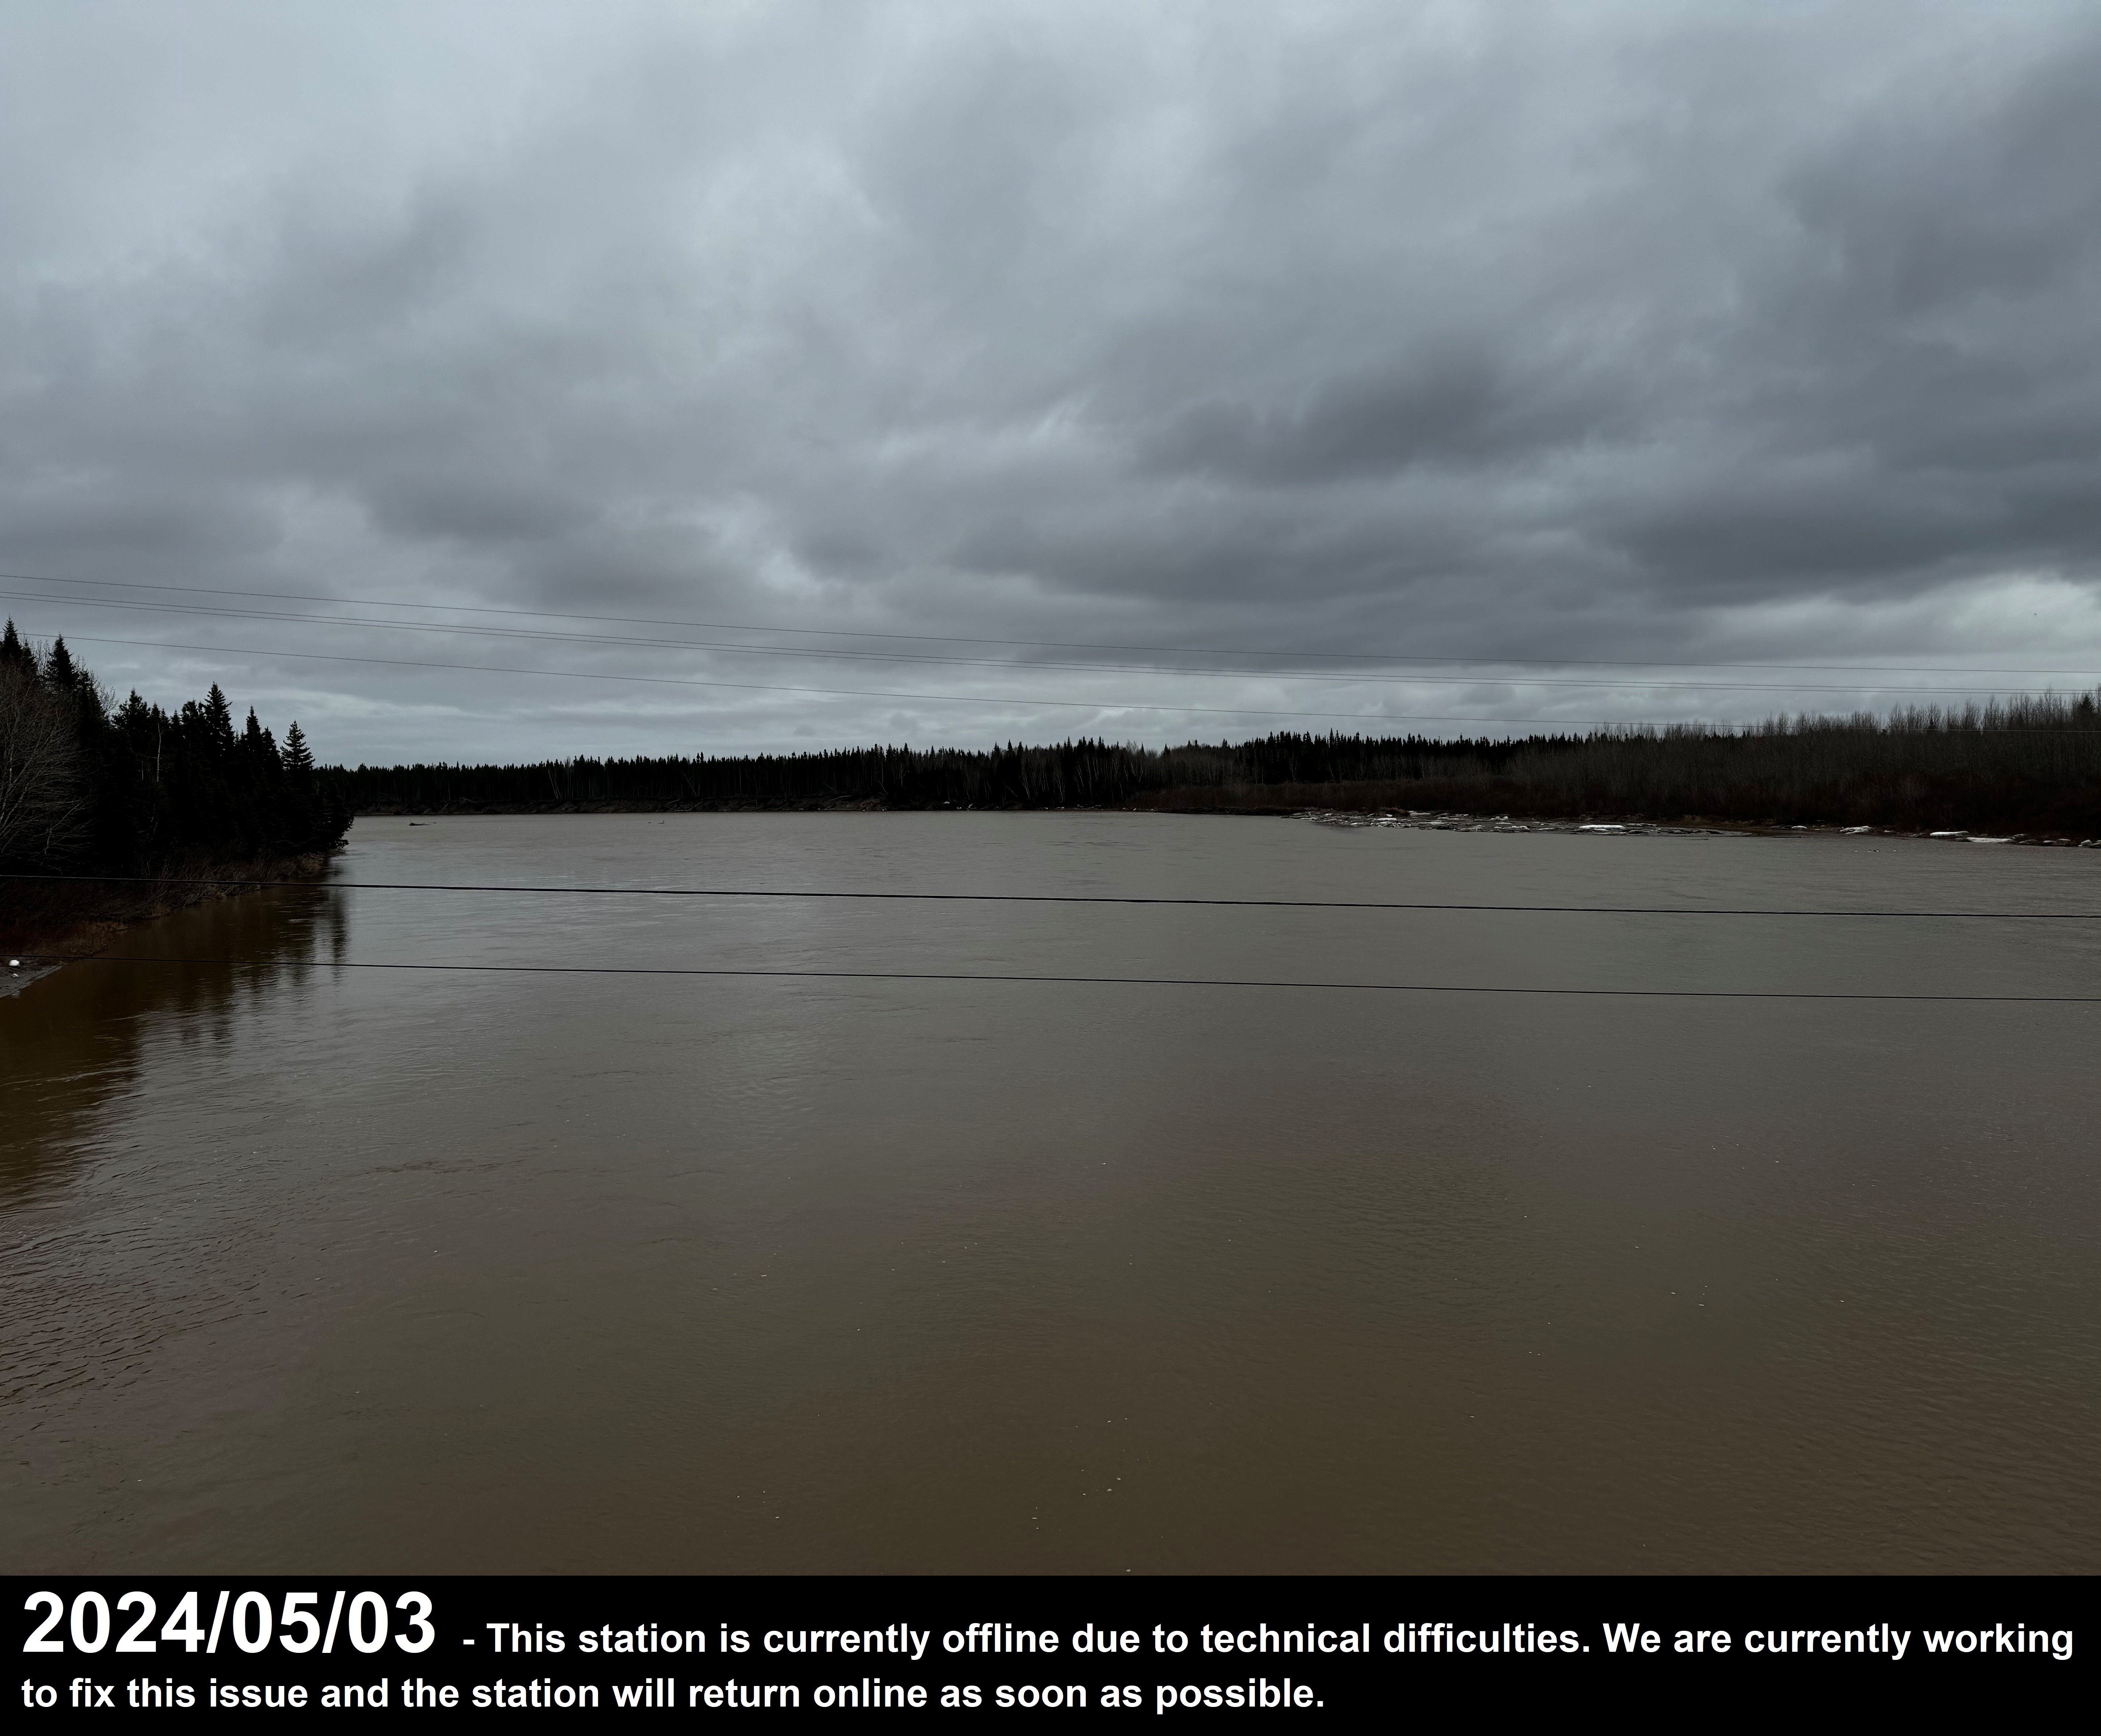
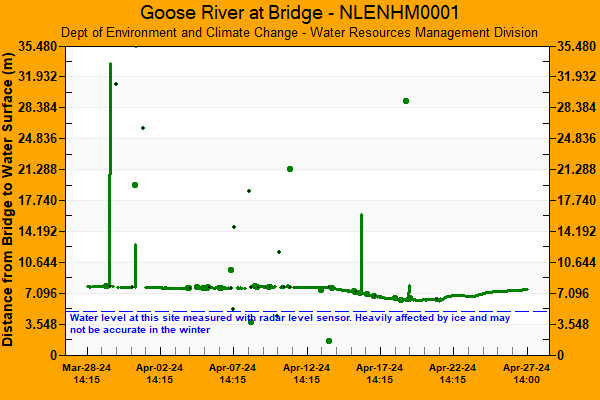
| Goose River at Bridge is used to monitor water level data in the Goose Bay area. The station is located at the bridge on Goose River, 23 km upstream of Rabbit Island. This station collects: Distance from sensor on bridge to river surface (if water level rises, the distance will decrease) and web camera images (camera pointed downstream ). |
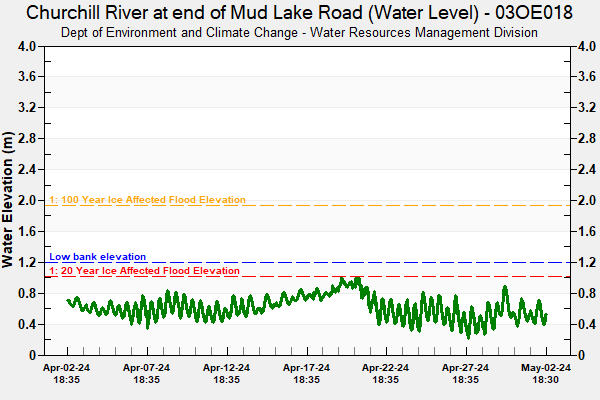
42km - Downstream of Muskrat Falls
2.5km -
Downstream of Mud Lake
Visit the Web Page for this Station
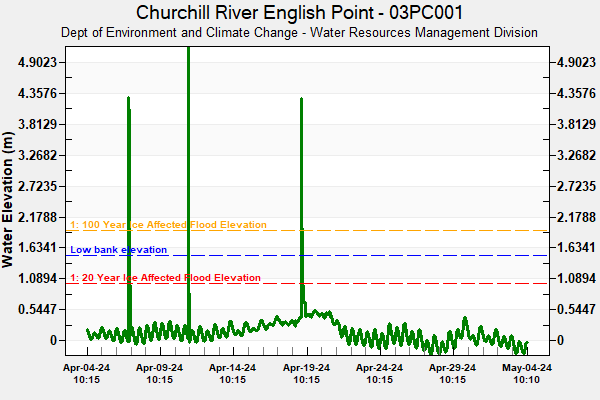
| Churchill River English Point is used to monitor baseline water level and water quality downstream of the Lower Churchill Hydroelectric Generation project. The station is located is 42 km downstream of Muskrat Falls and 2.5 km downstream of Mud Lake. It is defined as the end of the Churchill River. This station collects: Water Elevation (water level with surveyed elevation), Water Quality (instrument deployed from May to November), and Water Temperature. |
42km - Downstream of Muskrat Falls
2.5km -
Downstream of Mud Lake, Opposite River Bank
Mud Lake Crossing Camera
Station
Video Clip of Images From
Last Three Days (Avi file)
Visit the Web Page for this Station
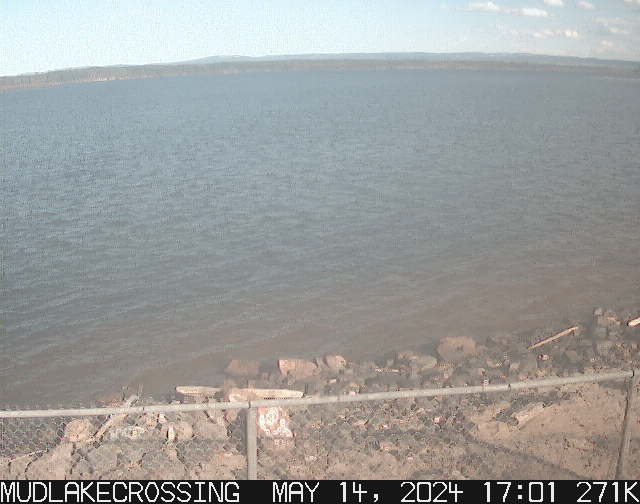
| Churchill River at end of Mud Lake Road is used for monitoring ice breakup along the Churchill River. This camera station is located 42 km downstream of Muskrat Falls and 2.5 km downstream of Mud Lake. It collects: Web camera images (camera pointed upstream). |
42km - Downstream of Muskrat Falls
2.5km -
Downstream of Mud Lake, Opposite River Bank
Mud Lake Road MET
Station
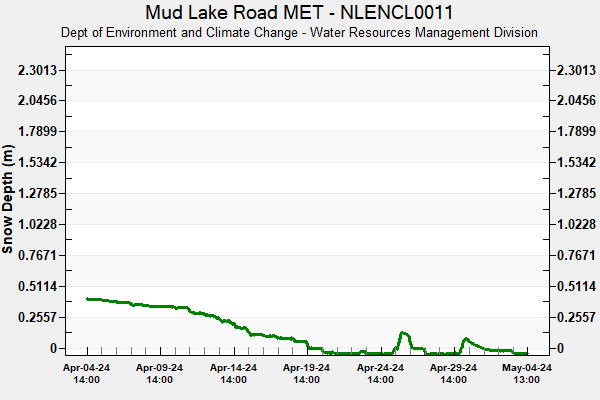
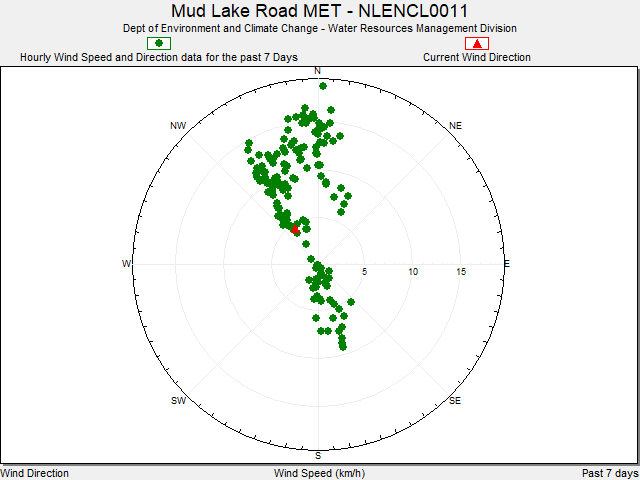
Visit the Web Page for this Station
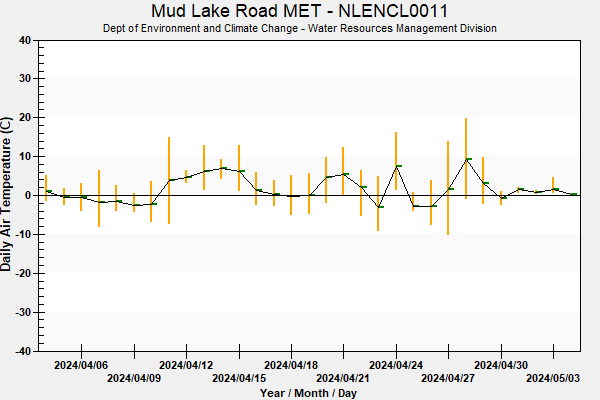
| Mud Lake Road MET is used for baseline climate data. This climate station is located 42 km downstream of Muskrat Falls and 2.5 km downstream of Mud Lake. It collects: Climate Data (air temperature, wind speed and direction, snow depth, etc.) |
42.2km - Downstream of Muskrat Falls
23km -
Downstream of Trans-Labrador Highway Bridge
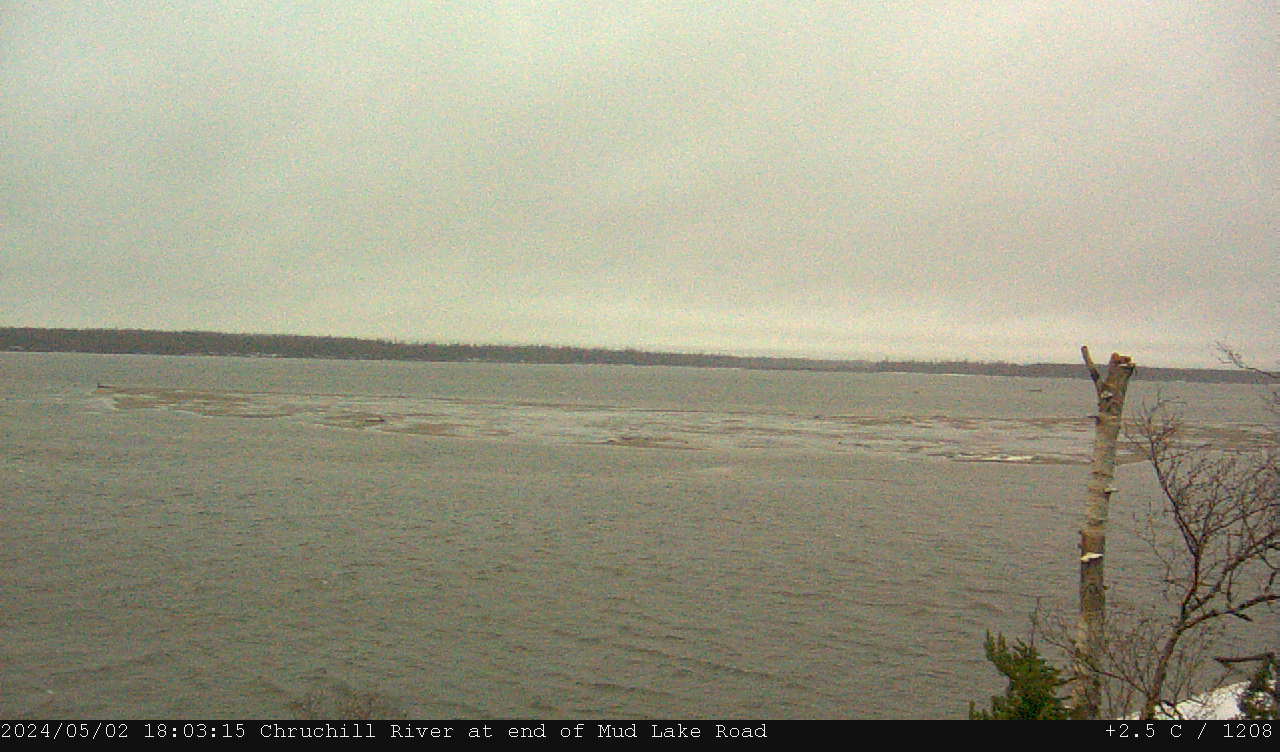
*Temperature listed in image is of the camera, not ambient air temperature.
Video Clip of Images From
Last Three Days (Avi file)
Visit the Web Page for this Station
| Churchill River at end of Mud Lake Road is used to monitor water elevation at this location. The station is located 42.2 km downstream of Muskrat Falls and 23 km downstream of the Trans-Labrador Highway Bridge. This station collects: Water Stage (water level with assumed elevation ), Water Temperature and web camera images (camera pointed upstream). |
40.5km - Downstream of Muskrat Falls
21.8m -
Downstream of Trans-Labrador Highway Bridge
(In the Community of Mud Lake
near the School)
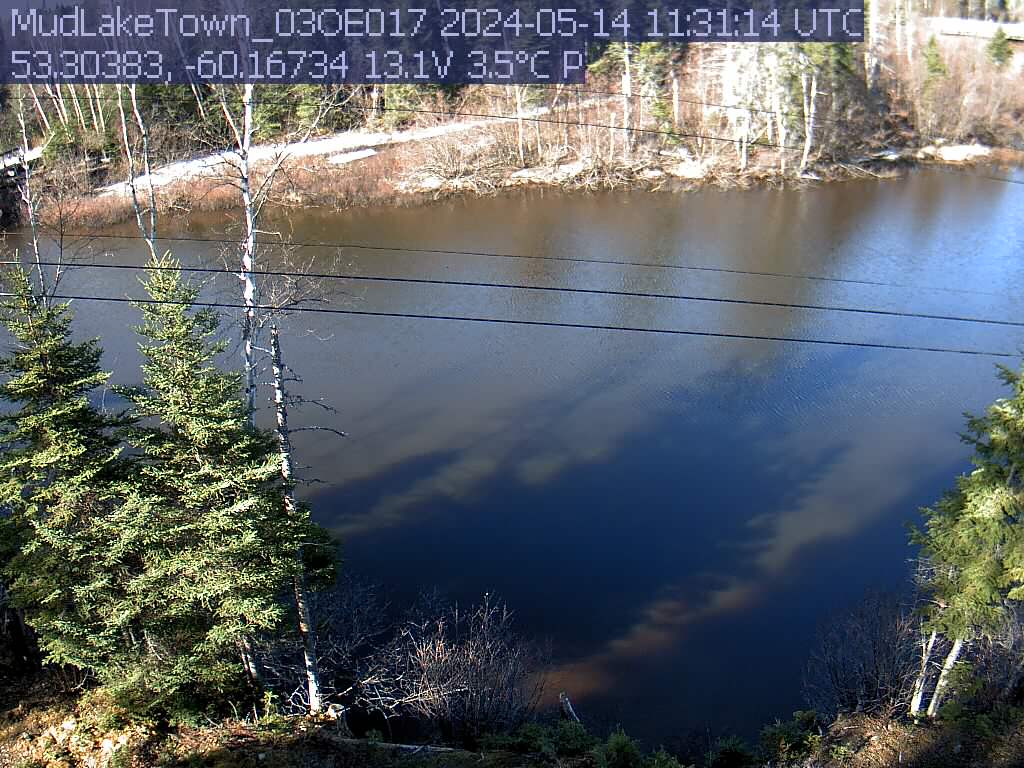
*Temperature listed in image is of the camera, not ambient air temperature.
Video Clip of Images From
Last Three Days (Avi file)
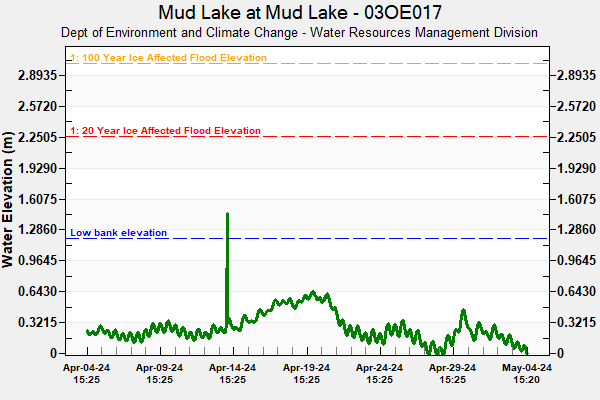
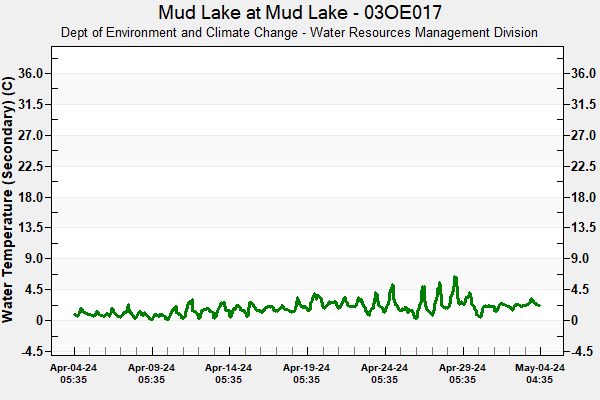
Visit the Web Page for this Station
| Mud Lake at Mud Lake (located at Mud Lake outlet) was established to monitor water levels in the Mud Lake tributary. The station is located in the community of Mud Lake near the school. This station collects: Water Elevation (water level with surveyed elevation), Water Temperature, and web camera images (camera pointed at Mud Lake Tributary). |
36.8km - Downstream of Muskrat Falls
18.6km -
Downstream of Trans-Labrador Highway Bridge
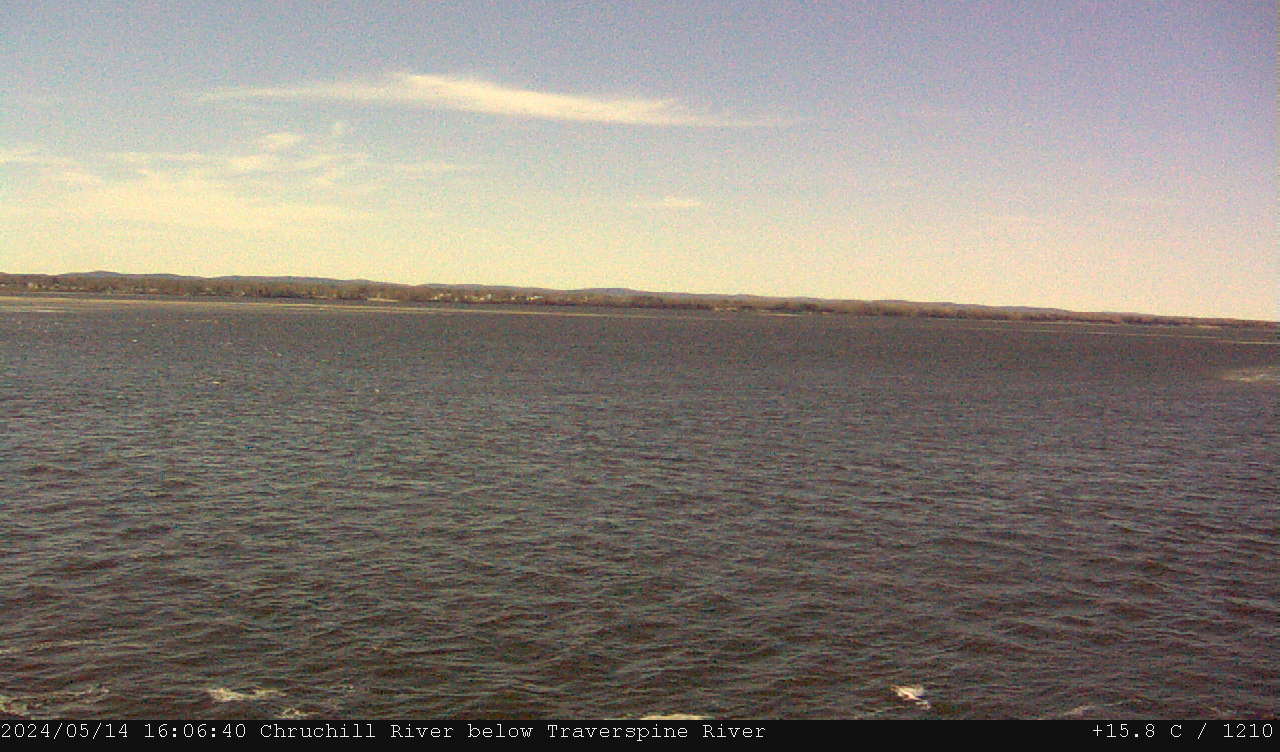
*Temperature listed in image is of the camera, not ambient air temperature.
Video Clip of Images From
Last Three Days (Avi file)
Visit the Web Page for this Station
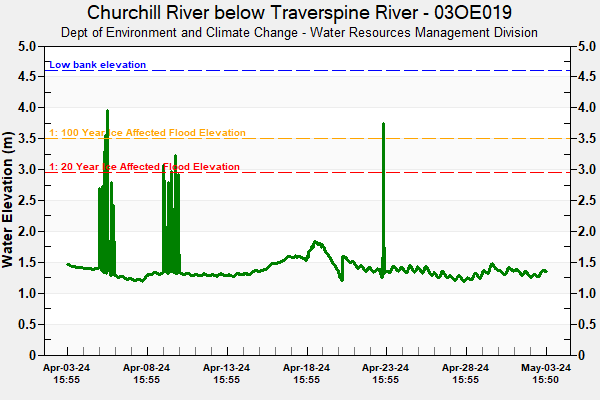
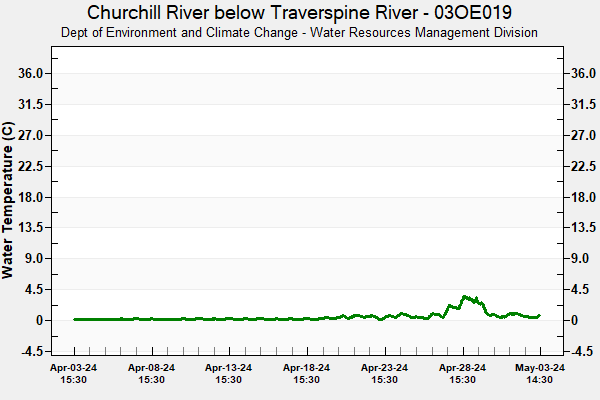
| Churchill River below Traverspine River is used to monitor water elevation at this location. The station is located 36.8 km downstream of Muskrat Falls and 18.6 km downstream of the Trans-Labrador Highway Bridge. This station collects: Water Elevation (water level with surveyed elevation), Water Temperature, and web camera images (camera pointed across the river towards Happy Valley). |
33km - Downstream of Muskrat Falls
14.3km -
Downstream of Trans-Labrador Highway Bridge
7.5km - Upstream of Mud Lake
(Near intersection of Hamilton River Road and Courte Real Road)
Visit the Web Page for this Station
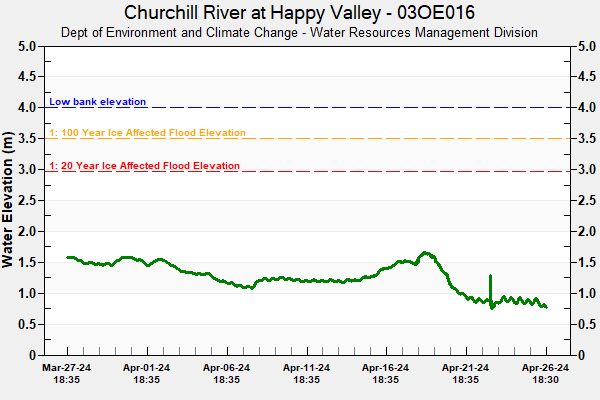
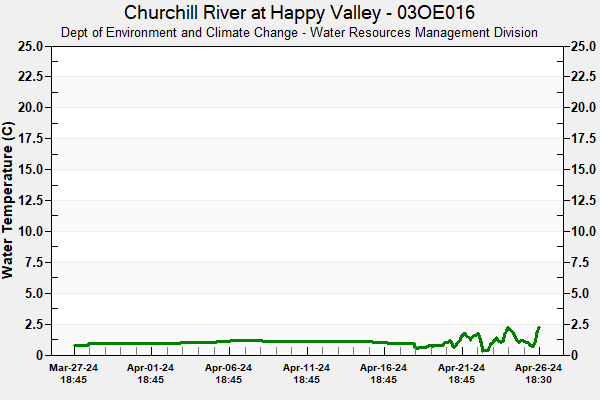
| Churchill River at Happy Valley was established to monitor water levels in the river at this location. The station is located 33 km downstream of Muskrat Falls, 14.3 km downstream of the causeway, and 7.5 km upstream of Mud Lake. . This station collects: Water Elevation (water level with surveyed elevation) and Water Temperature. |
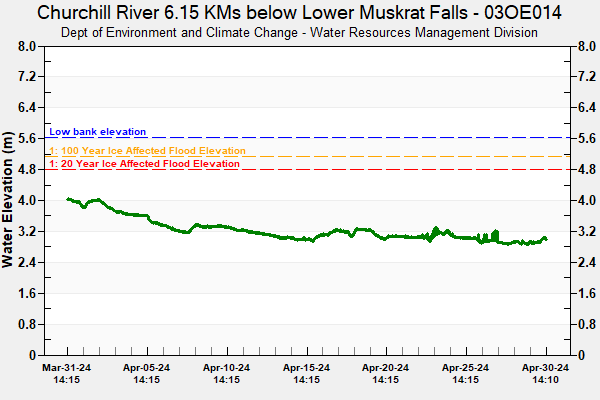
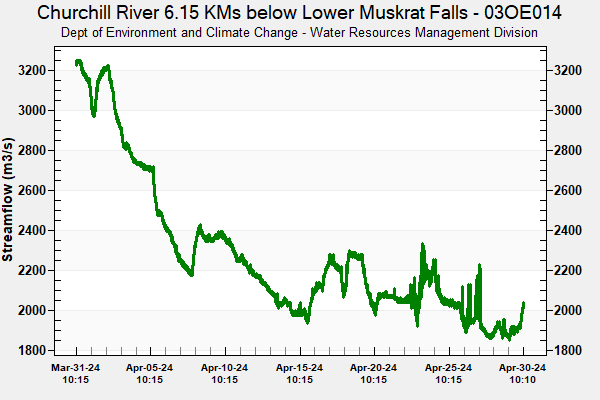
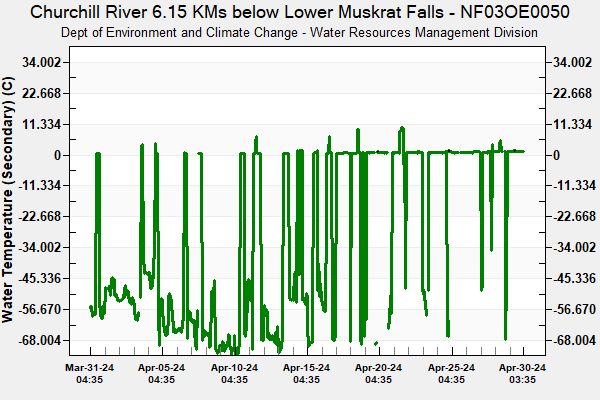
6.15km - Downstream of Muskrat Falls
12.5km -
Upstream of Trans-Labrador Highway Bridge
34km - Upstream of Mud Lake
Visit the Web Page for this Station
| Churchill River 6.15 km below Lower Muskrat Falls was established to monitor baseline water quality and quantity at the proposed Muskrat Falls site of the Lower Churchill Hydroelectric Generation project. The station is located 6.15 km downstream of Muskrat Falls, 12.5 km upstream of the causeway and 34 km upstream of Mud Lake. This station collects: Water Elevation (water level with surveyed elevation), Water Quality (instrument deployed from May to November), and Water Temperature. Water elevation data at this station helps indicate when water is released from the Muskrat Falls. Note that streamflow at this location will soon be reported to determine how much water is being released from Muskrat Falls. |
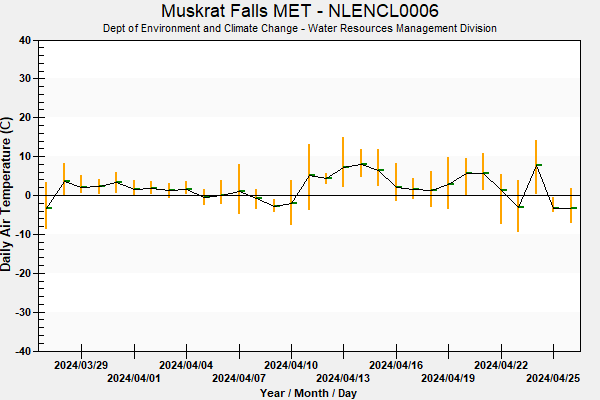
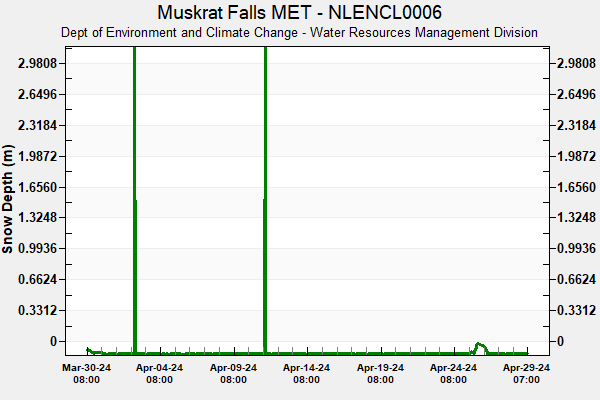
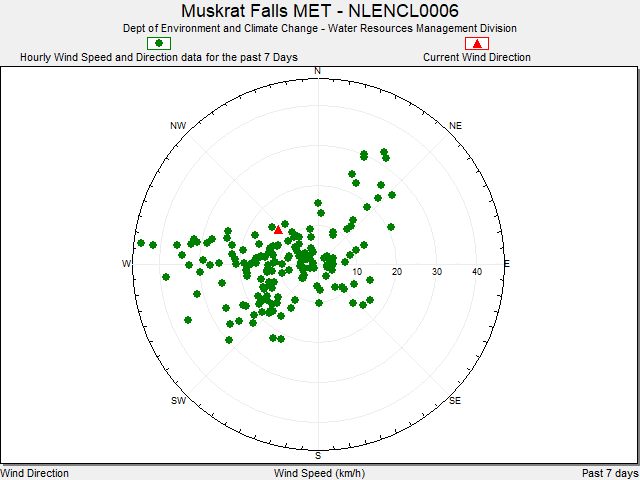
Visit the Web Page for this Station
| Muskrat Falls MET is used for Muskrat Falls operations. This climate station is located at the Muskrat Falls site. It collects: Climate Data (air temperature, wind speed and direction, snow depth, etc.). |
Upper Portion of Muskrat Falls Reservoir
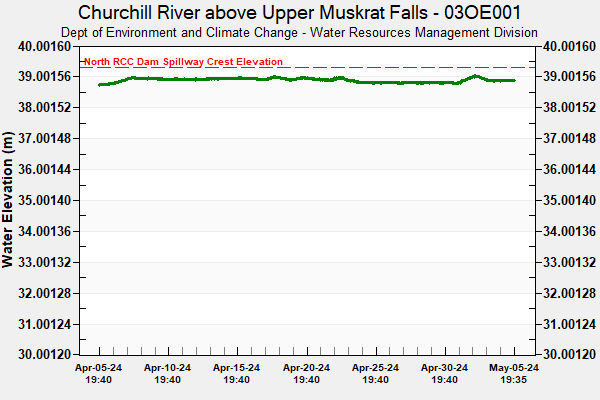
Visit the Web Page for this Station
| Churchill River Above Upper Muskrat Falls was established to monitor water level on the Churchill River. The station is located in the upper portion of Muskrat Falls Reservoir. This station collects: Water Elevation (water level with surveyed elevation) and Water Temperature. |
42km - Upstream of Muskrat Falls, 40km upstream on a tributary draining into the Churchill River
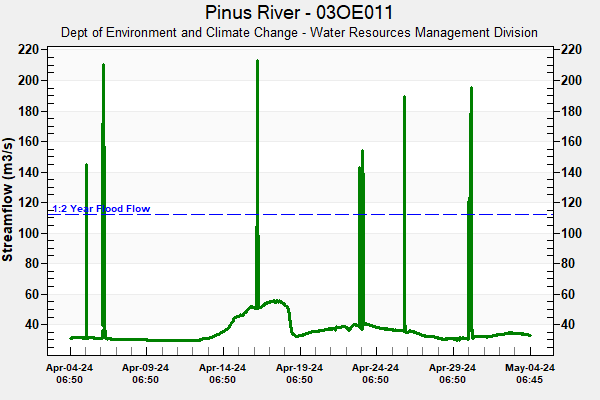
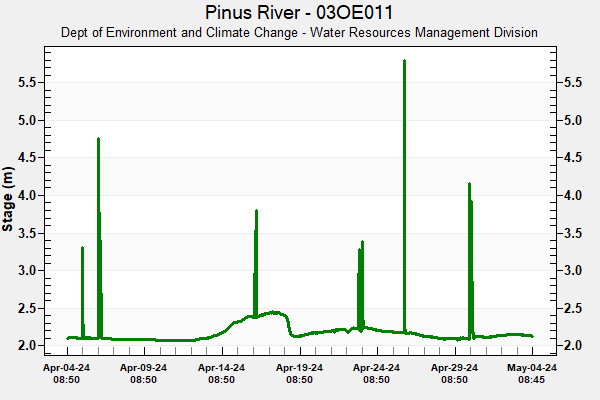
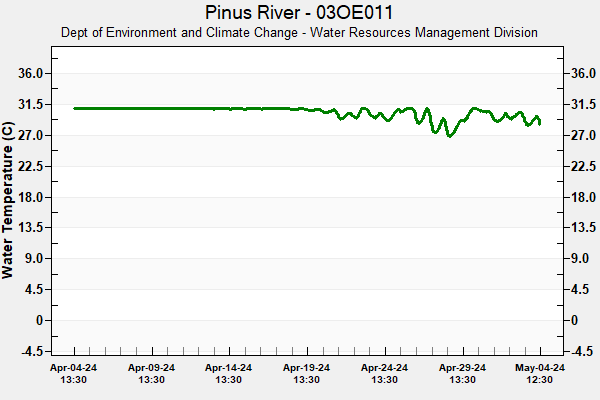
Visit the Web Page for this Station
| Pinus River is used for monitoring baseline streamflow. The station is located 42 km upstream of Muskrat Falls, and 40 km upstream on a tributary draining into the Churchill River. This station collects: Water Stage (water level with assumed elevation), Water Temperature, and Streamflow. |
57 km - Upstream of Muskrat Falls
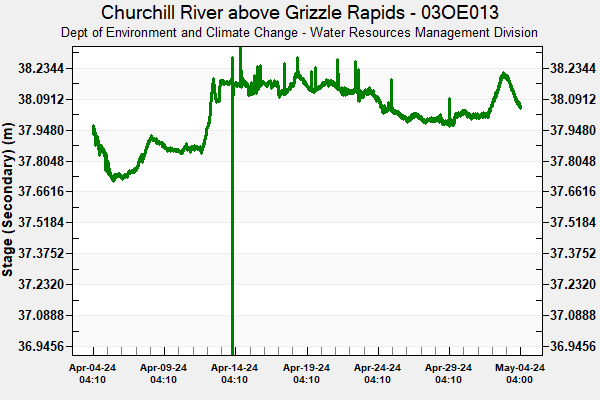
Visit the Web Page for this Station
| Churchill River Above Grizzle Rapids is used to monitor baseline water quantity and quality data. The station is located 57 km upstream of Muskrat Falls. This station collects: Water Elevation (water level with surveyed elevation), Water Quality (instrument deployed from June to November), Water Temperature, and Streamflow. |
168 km from Muskrat Falls
22km - North of Station 03OD009 Churchill
River below Metchin River
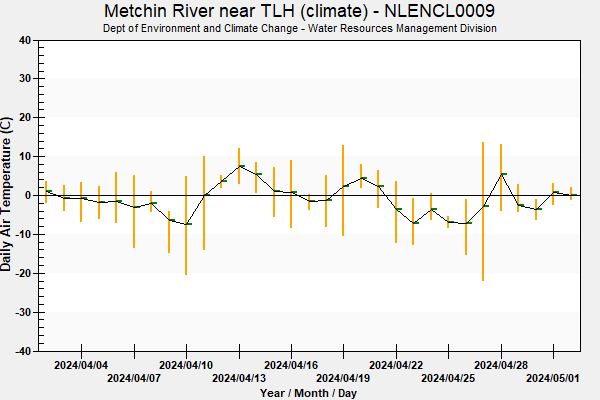
Visit the Web Page for this Station
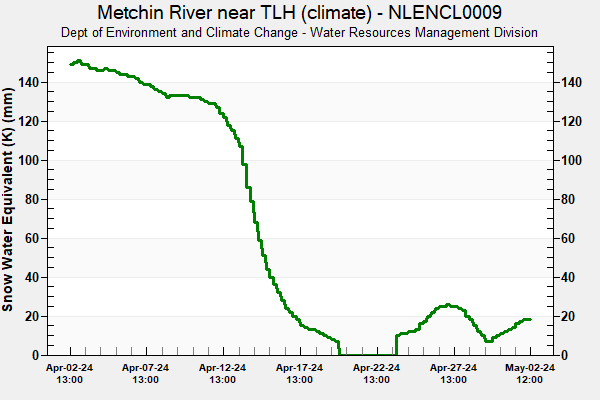
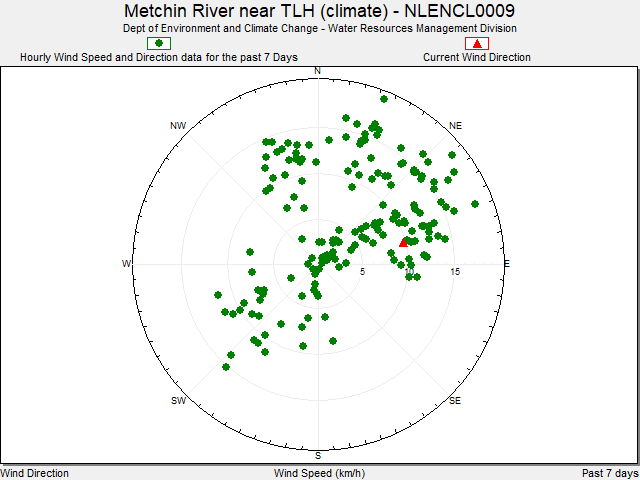
| Metchin River near TLH is used for ambient climate monitoring. This climate station is located 168 km from Muskrat Falls and 22 km north of station 03OD009 (Churchill River below Metchin River). It collects: Climate data (air temperature, wind speed and direction, snow water equivalent, etc.). |
221km - Upstream of Muskrat Falls
Visit the Web Page for this Station
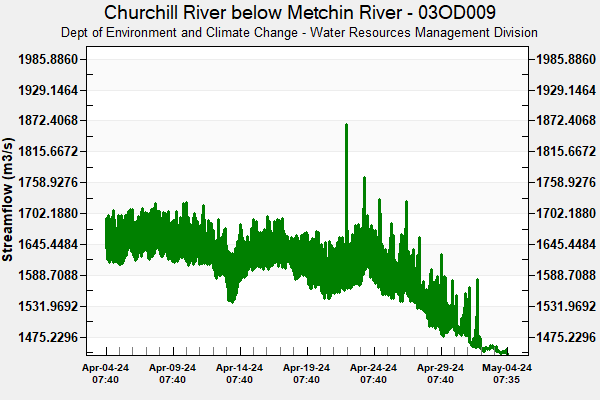
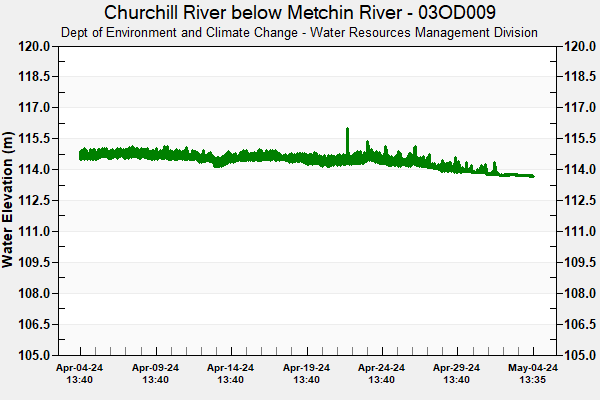
| Churchill River below Metchin River was established to monitor baseline water quality and quantity data. The station is located 221 km upstream of Muskrat Falls. This station collects: Water Elevation (water level with surveyed elevation), Streamflow, and Water Quality (instrument deployed from May to November). |
278km - Upstream of Muskrat Falls
Visit the Web Page for this Station
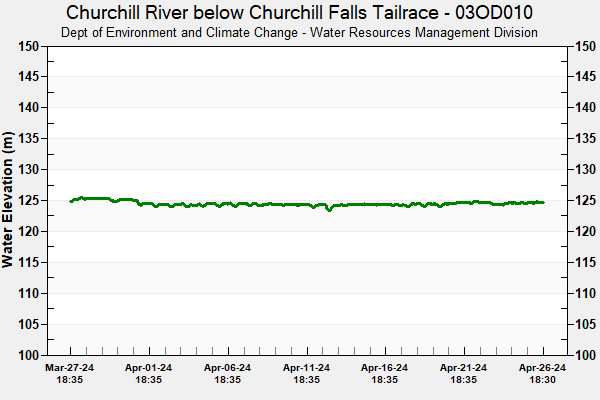
| Churchill River below Churchill Falls Tailrace is used to monitor water elevation at the Churchill Falls tailrace. The station is located 278 km upstream of Muskrat Falls. This station collects: Water Elevation (water level with surveyed elevation). |
278km - Upstream of Muskrat Falls
Visit the Web Page for this Station
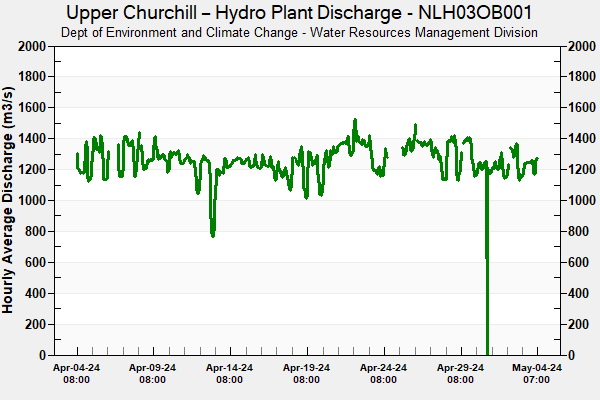
| Upper Churchill - Hydro Plant Discharge was established by NL Hydro to monitor flows for plant operations at the Churchill Falls Generating Station. With 11 generating units, the flow depends on which units are on at the time, which in turn depends on load demand. The station is located at the Churchill Falls tailrace, approximately 278 km upstream of Muskrat Falls. This station measures regulated hourly average flows. |
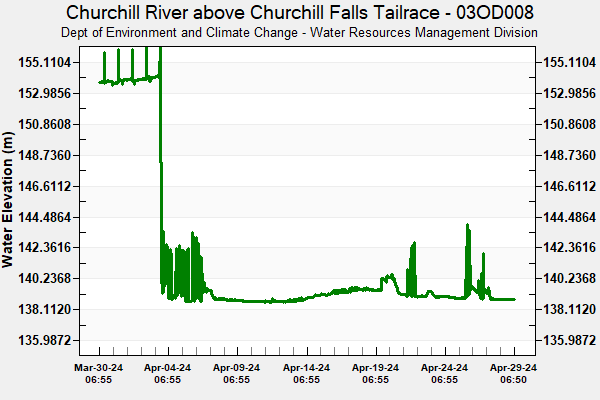
291 km - Upstream of Muskrat Falls
(This
hydrometric station is the furthest from Muskrat Falls)
Visit the Web Page for this Station
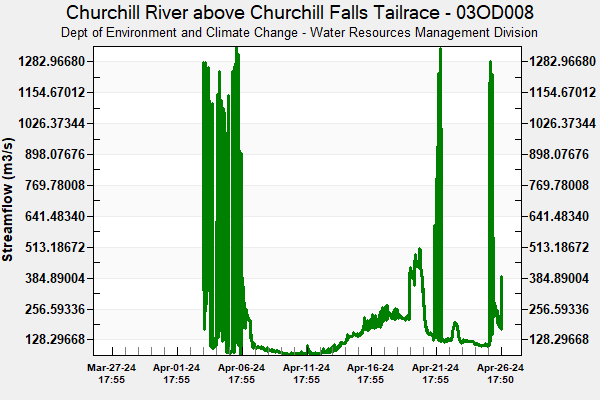
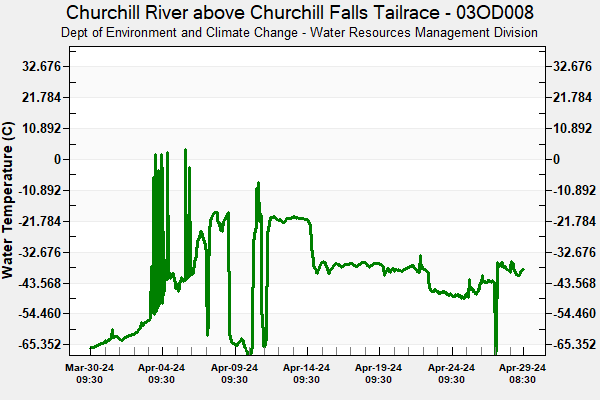
| Churchill River above Churchill Falls Tailrace was established to monitor baseline streamflow monitoring. The station is located 291 km upstream of Muskrat Falls (furthest hydrometric station from Muskrat Falls). This station collects: Water Elevation (water level with surveyed elevation), Water Temperature, and Streamflow. |
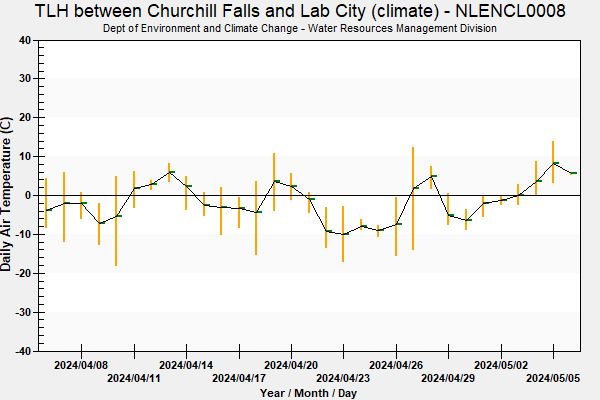
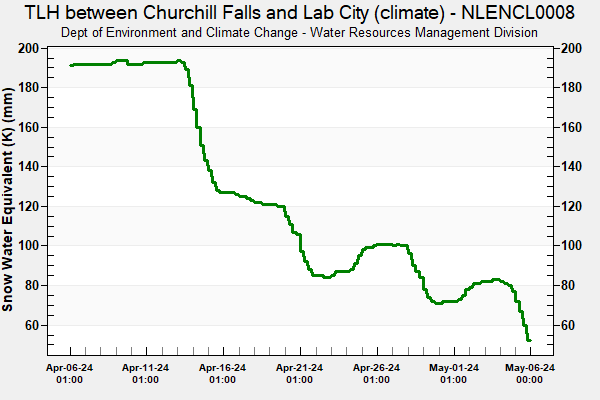
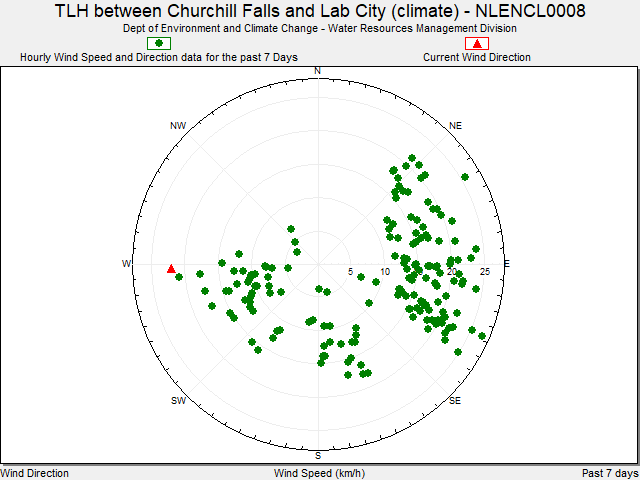
320 km from Muskrat Falls
97 km - Southwest of Station 03OD008 Churchill
River above Churchill Falls Tailrace
Visit the Web Page for this Station
| This climate station is located 320 km from Muskrat Falls and 97 km southwest of station 03OD008 (Churchill River above Churchill Falls Tailrace). It collects: Climate data (air temperature, wind speed and direction, snow water equivalent, etc.). |
All Stations in the Churchill River Drainage Basin
| Churchill River and Lake Melville | ||||||||||||
| Tertiary Basin | Name | Stage-Flow | Vertical Datum | Flood Warning | WQ | Climate | Snow |
Water Temp |
GW | Camera | ADRS | EC |
| 03OE | Churchill River 6.15kms below Lower Muskrat Falls | Elevation/Flow | CGVD28 | FW | NF03OE0050 | EC | ||||||
| 03OD | Churchill River above Churchill Falls Tailrace | Elevation/Flow | CGVD28 | 03OD008 | EC | |||||||
| 03OE | Churchill River Above Upper Muskrat Falls | Elevation/Flow | CGVD28 | WQ | WT | 03OE001 | EC | |||||
| 03OE | Churchill River at end of Mud Lake Road (Water Level) | Elevation | CGVD28 | FW | WT |
|
03OE018 | EC | ||||
| 03OE | Churchill River at end of Mud Lake Road (Weather) | Climate | Snow |
|
NLENCL0004 | |||||||
| 03PC | Churchill River at English Point | Elevation/Flow | CGVD2013 | FW | WQ | WT | NF03OE0054 | EC | ||||
| 03OE | Churchill River at Happy Valley down from Courte Real Road | Elevation/Flow | CGVD28 | FW | 03OE016 | EC | ||||||
| 03OE | Churchill River Above Grizzle Rapids | Elevation/Flow | CGVD28 | WQ | 03OE013 | EC | ||||||
| 03OD | Churchill River below Churchill Falls Tailrace | Elevation/Flow | CGVD28 | 03OD010 | EC | |||||||
| 03OD | Churchill River below Metchin River | Elevation/Flow | CGVD28 | WT | NF03OD0013 | EC | ||||||
| 03OE | Churchill River below Traverspine River | Elevation | CGVD28 | FW | WT |
|
03OE019 | EC | ||||
| 03PC | Goose River at Bridge |
|
NLENHM0001 | |||||||||
| 03OE | Metchin River near TLH (climate) | Climate | Snow | NLENCL0009 | ||||||||
| 03OE | Mud Lake Outlet Tributary at Mud Lake | Elevation | CGVD28 | FW |
|
03OE017 | EC | |||||
| 03OE | Mud Lake Road MET | Climate | Snow | NLENCL0011 | ||||||||
| 03OE | Muskrat Falls MET | Climate | Snow | NLENCL0006 | ||||||||
| 03OE | Pinus River | Stage/Flow | Assumed | WT | 03OE011 | EC | ||||||
| 03PD | Rabbit Island at the Outlet of the Churchill River | Elevation | CGVD2013 | WT | 03PD002 | EC | ||||||
| 03OE | TLH between Churchill Falls and Lab City (climate) | Climate | Snow | NLENCL0008 | ||||||||
Note: The date/times shown on the graphs are NST. There is no adjustment made for Daylight Savings Time.
| The station characteristics described below give a general overview of the sensors installed at each site. | |
| Definitions | Description |
| Tertiary Basin | The Water Survey of Canada has a 3-level hierarchy of drainage areas for the purpose of managing hydrometric stations. The first two digits indicate the major drainage basin based on the ocean to which it flows. The last two letters indicate a sub-basin (tertiary) of the major drainage basin. A full hydrometric station identifier ends in three digits which indicate the nth station installed in that basin. |
| Stage-Flow | Water elevation, stage and/or flow are measured. A more complete description of these terms is available here. |
| Vertical Datum | A vertical datum is a reference surface that represents zero, against which elevations are measured. The location of zero can be arbitrary (assumed datums), based on decades of level lines (CGVD28), or more recently; on a model of the planet’s gravity field from satellites (CGVD2013). |
| Flood Warning | FW - Stage or Water Elevation graph at this station contains flood warning lines. HF - Streamflow graph at this station contains high flow alert lines. |
| WQ | Water Quality parameters are measured. Additional information on the Real-Time Water Quality Program is available here |
| Climate | Climate parameters such as precipitation, air temperature, etc are measured |
| Snow | These are climate stations where parameters such as snow depth, snow-water equivalent etc. are measured, |
| Water Temp | Water Temperature is measured at this site. |
| GW | This site is a drilled well where Groundwater elevation is measured. |
| Camera | A Webcam is installed at this site. |
| ADRS | This link displays the web
page for this station which includes graphs of all data and downloadable
csv files. Due to the volume and frequent updating of the data the streamflow, water quality and climate data shown is PROVISIONAL and has not undergone quality control checks. These data may be subject to significant change. |
| EC | This link is to the Environment Canada, Water Survey of Canada web page for this station. Provisional Stage-Flow data and Stage-Flow data that has gone through a comprehensive QA/QC procedure are available. There are also links to historical publication quality Stage-Flow data and summaries for each station. |